September 2023
1 Week
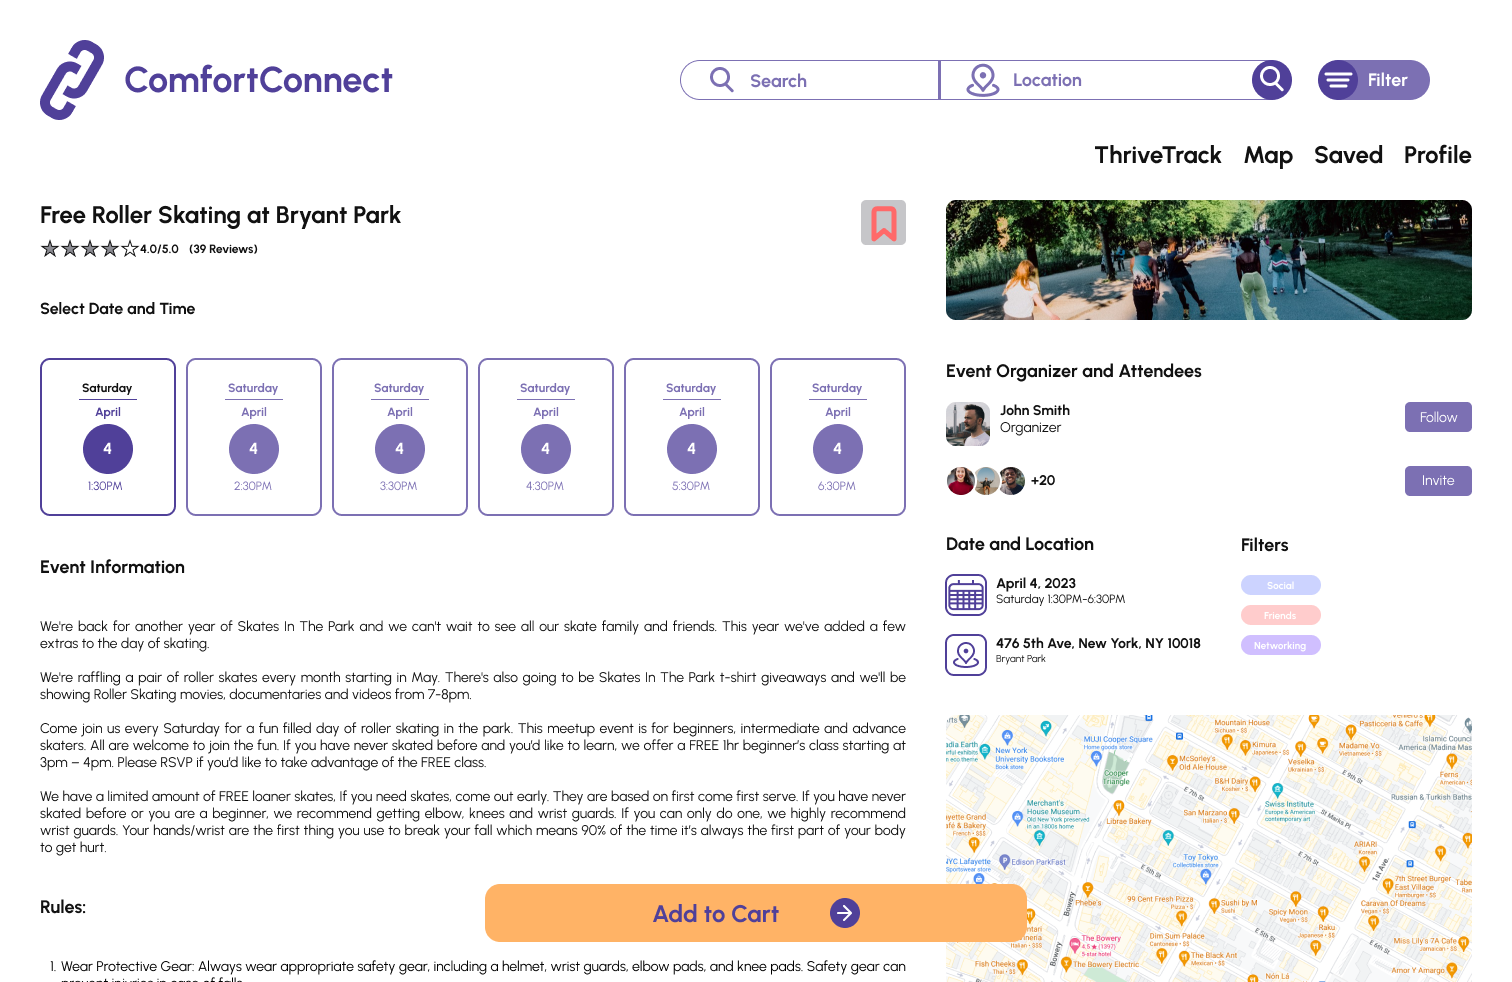
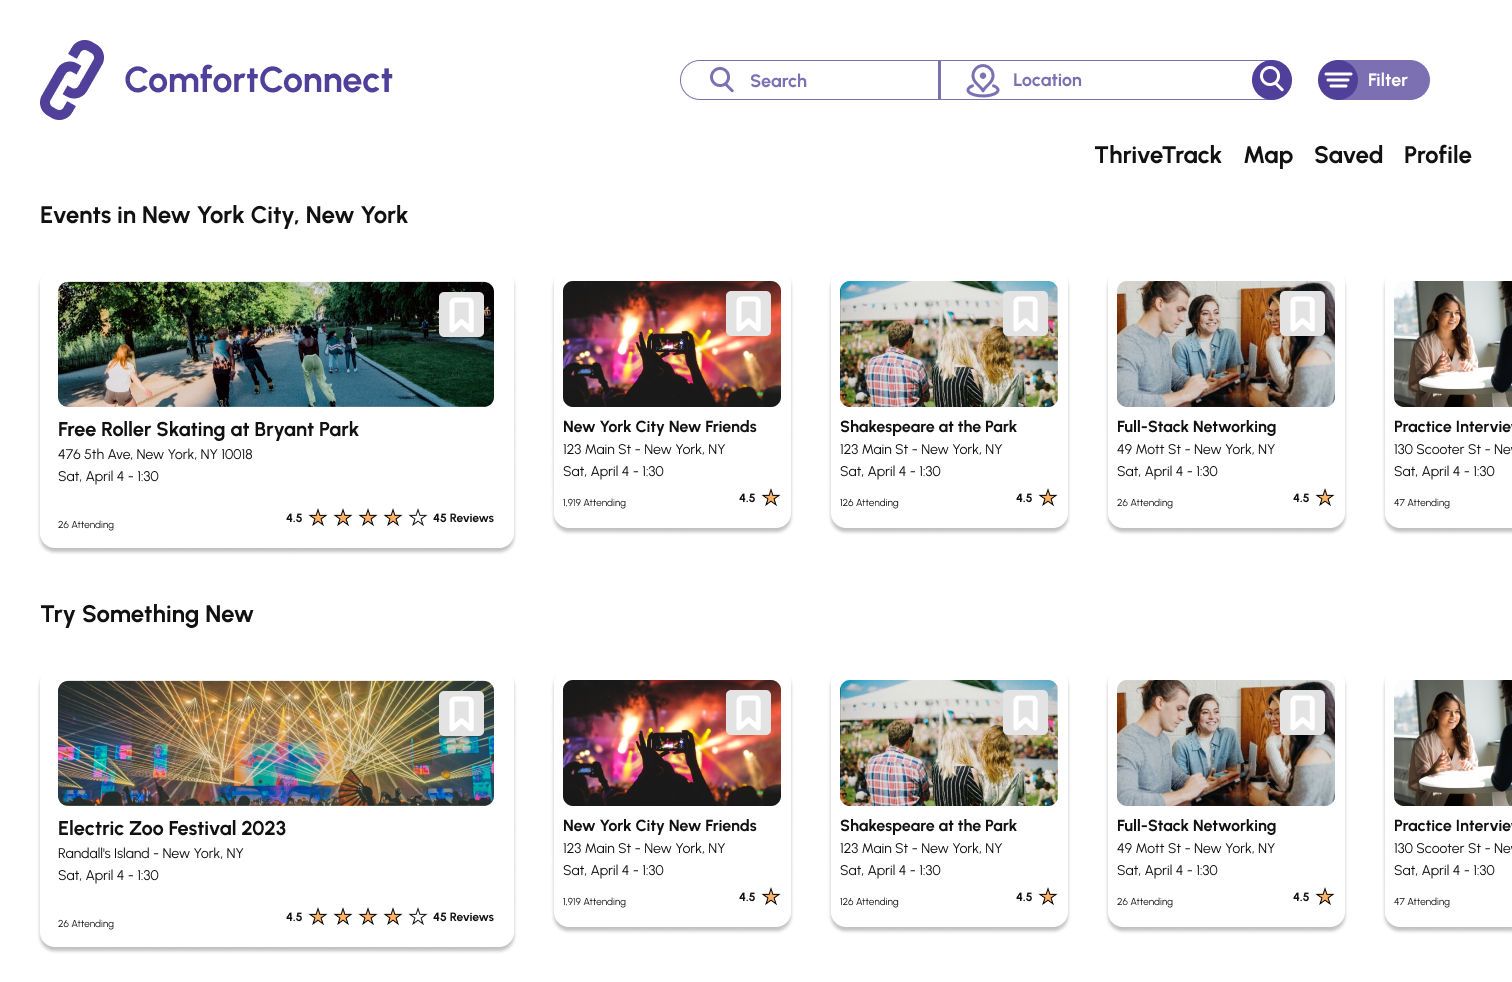
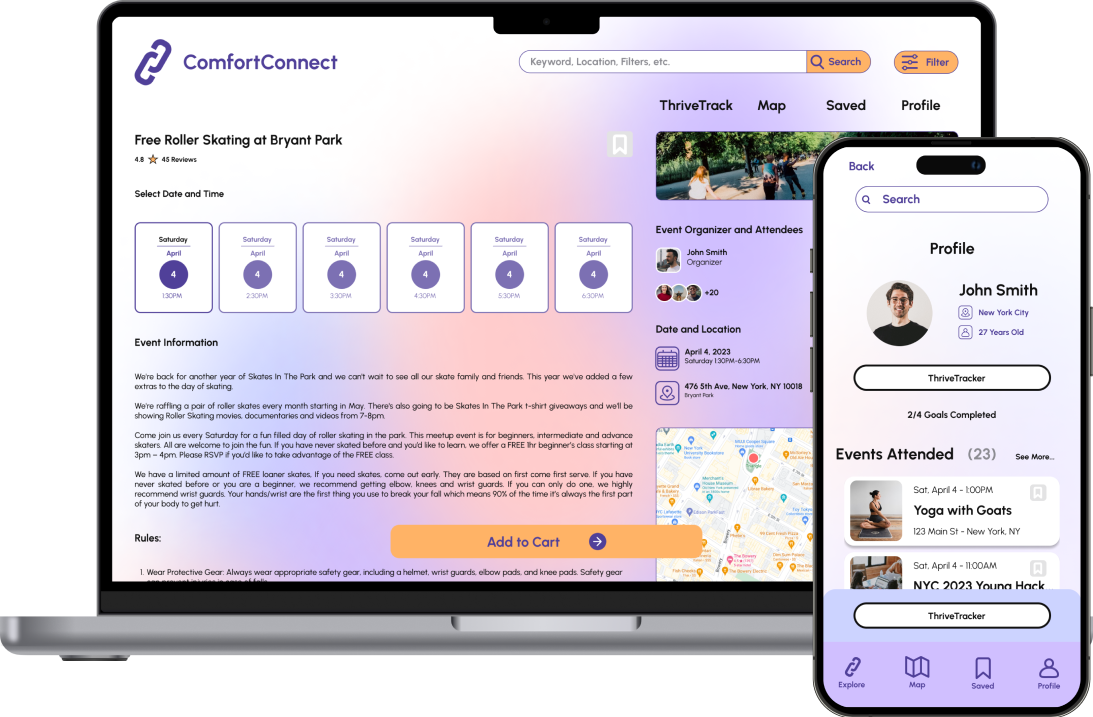
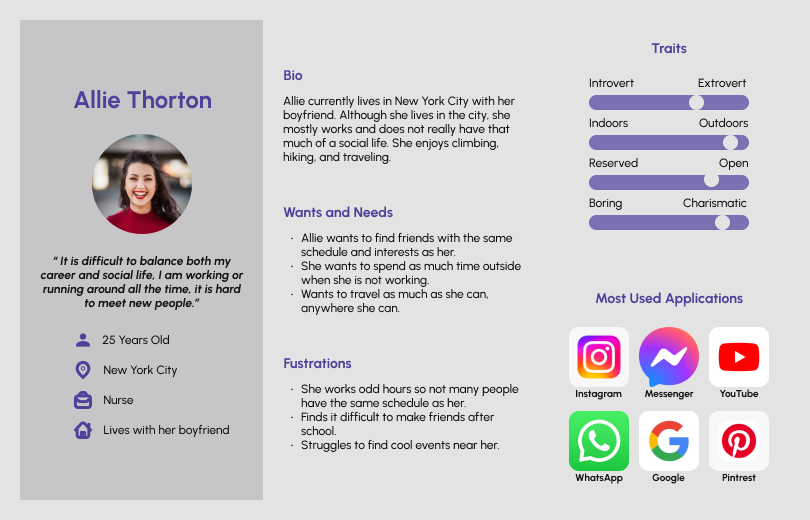
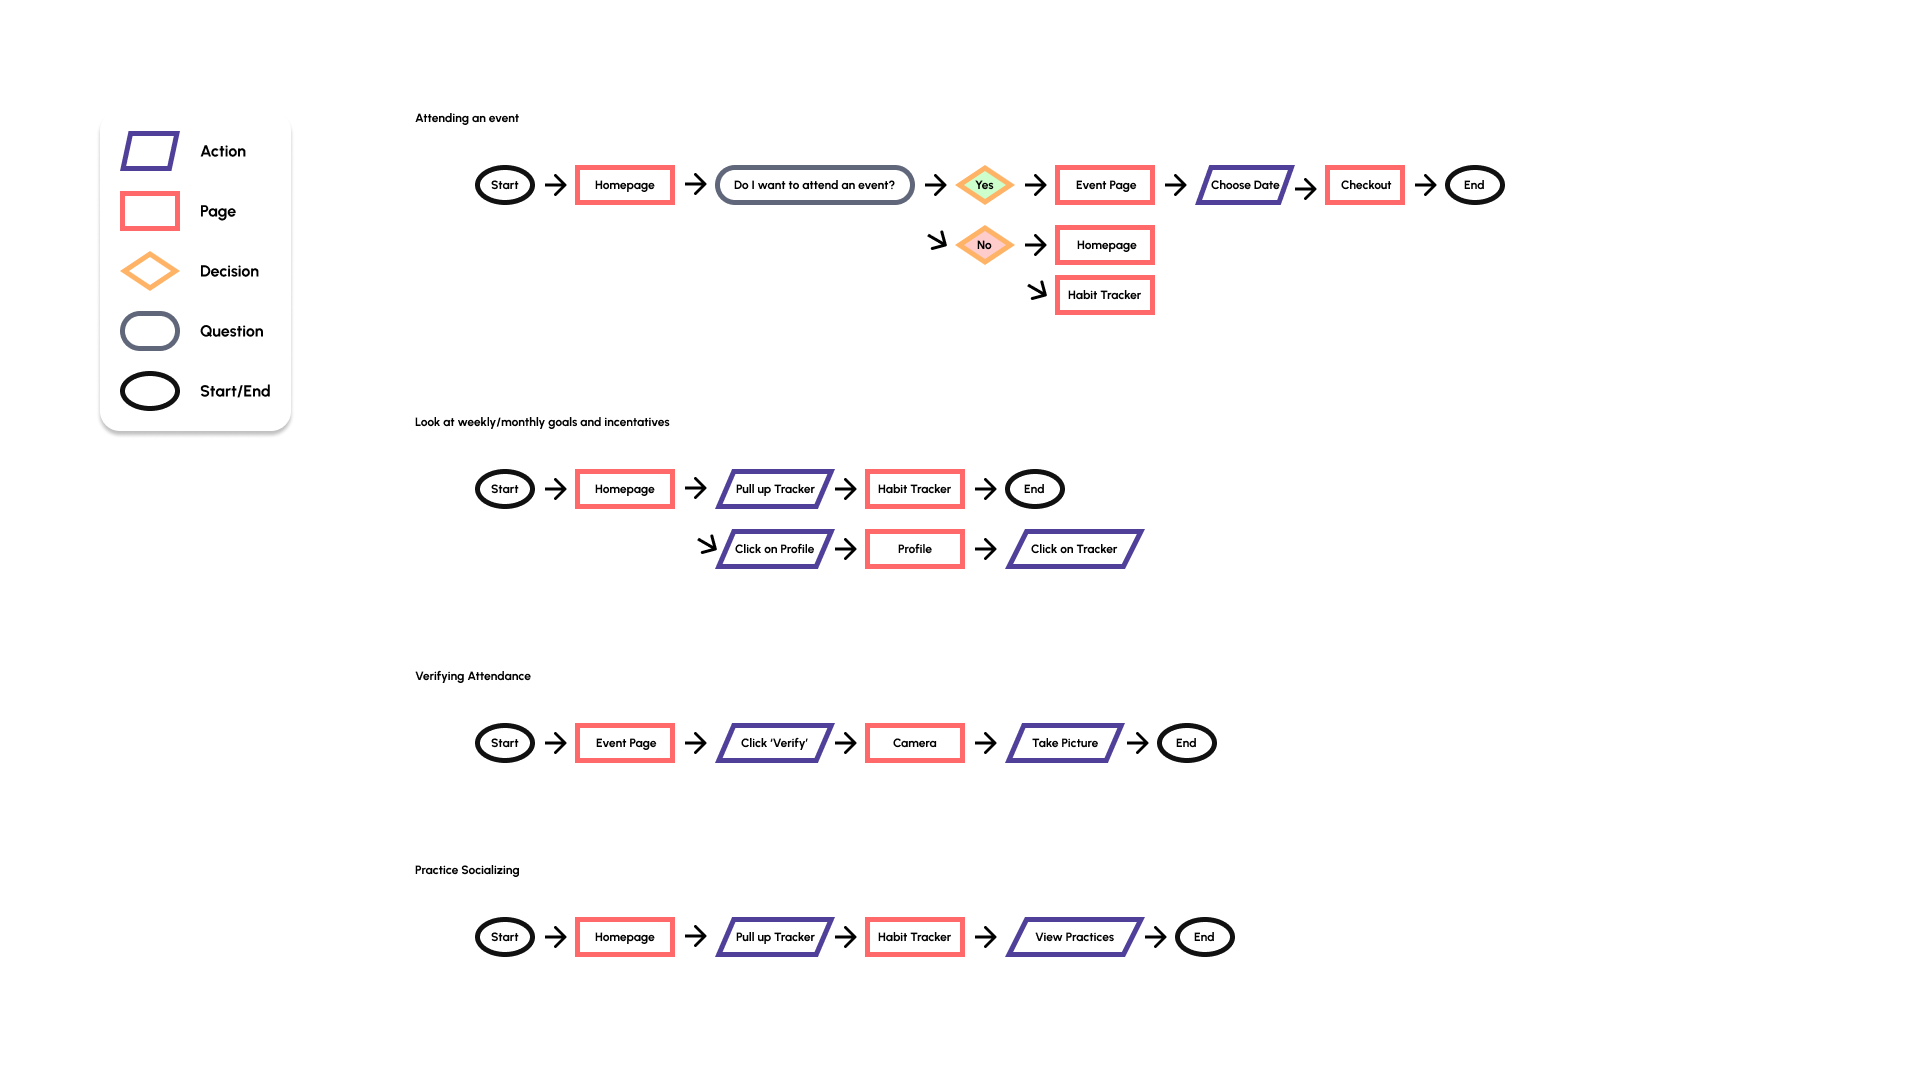
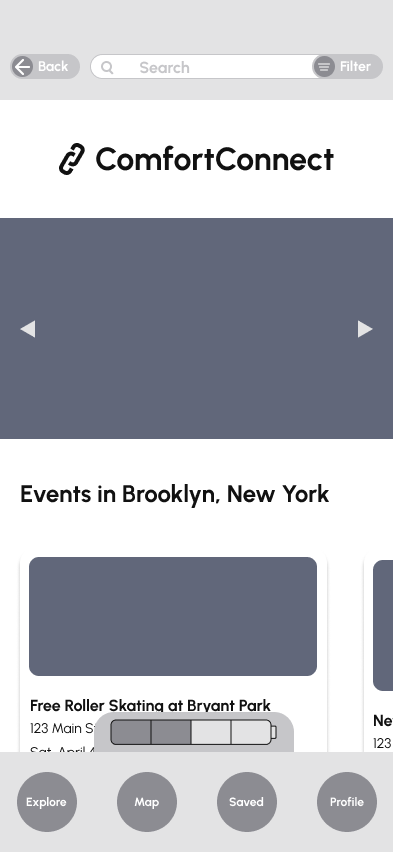
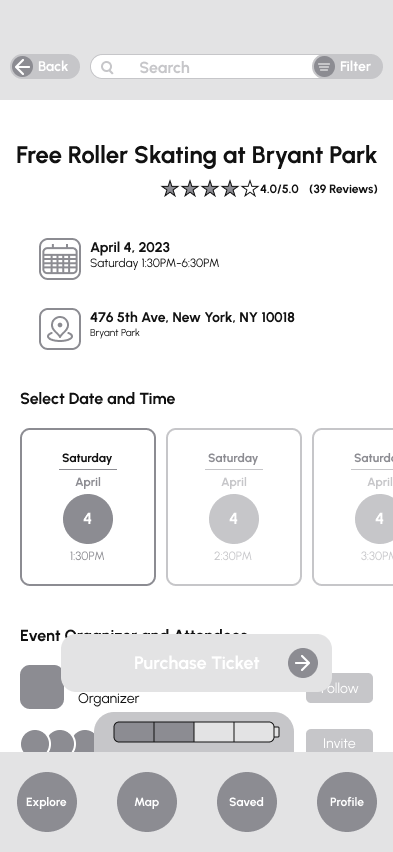
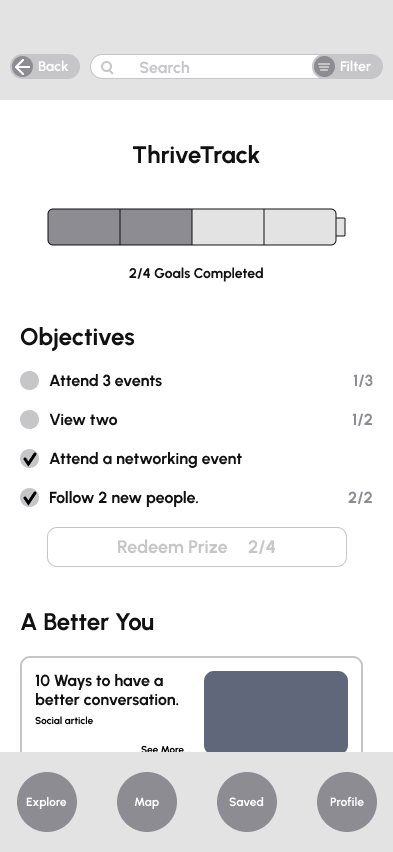
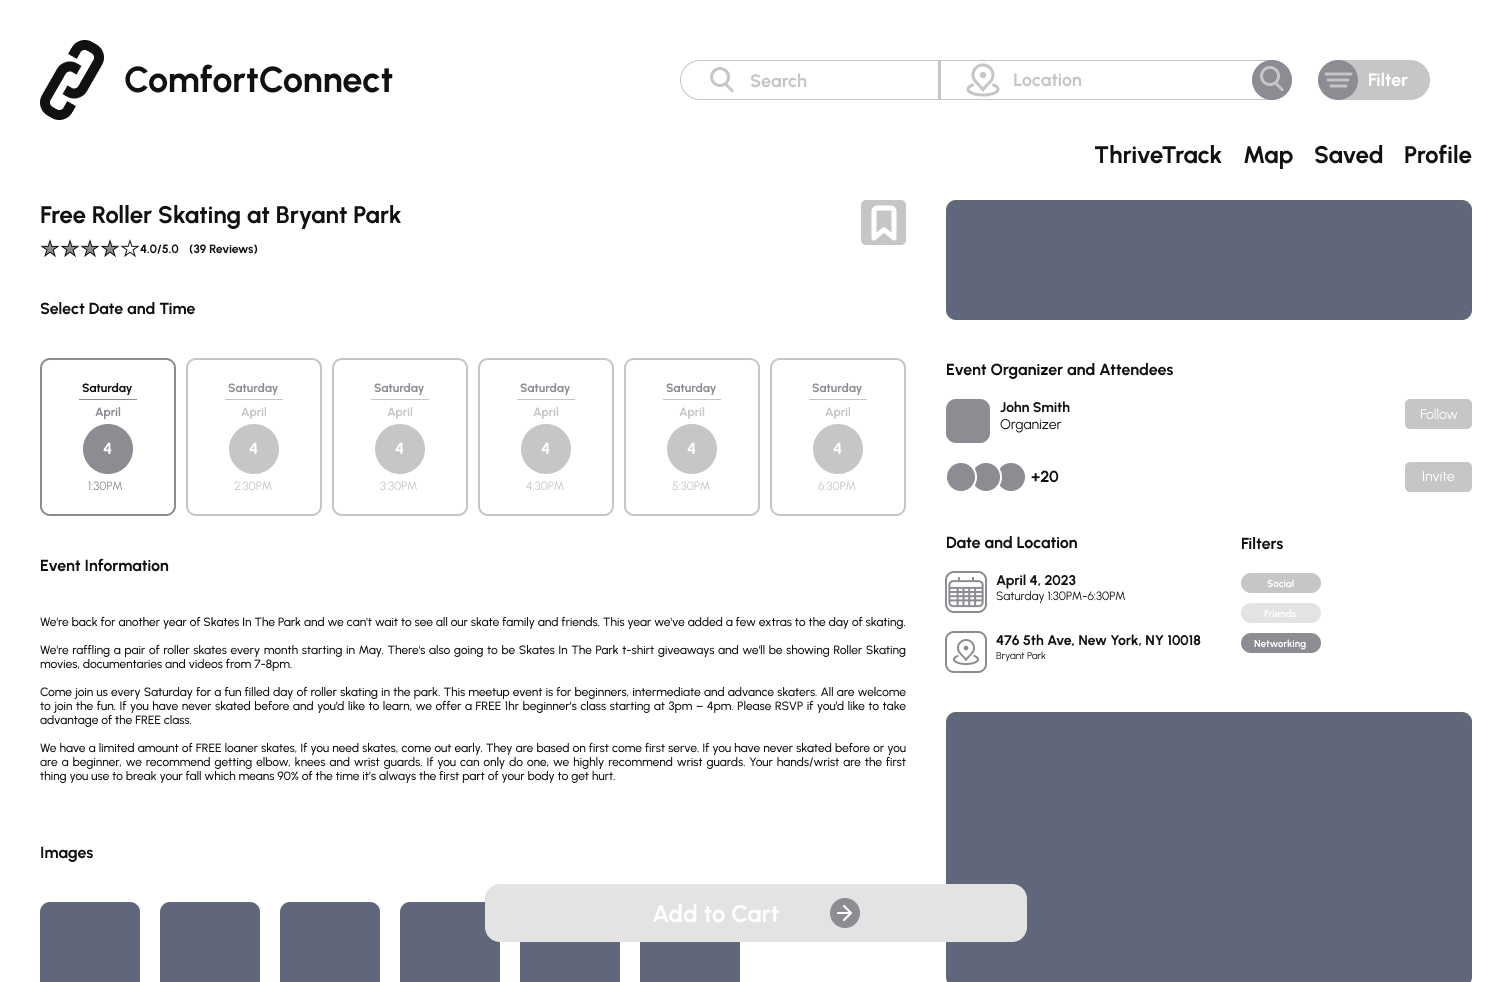
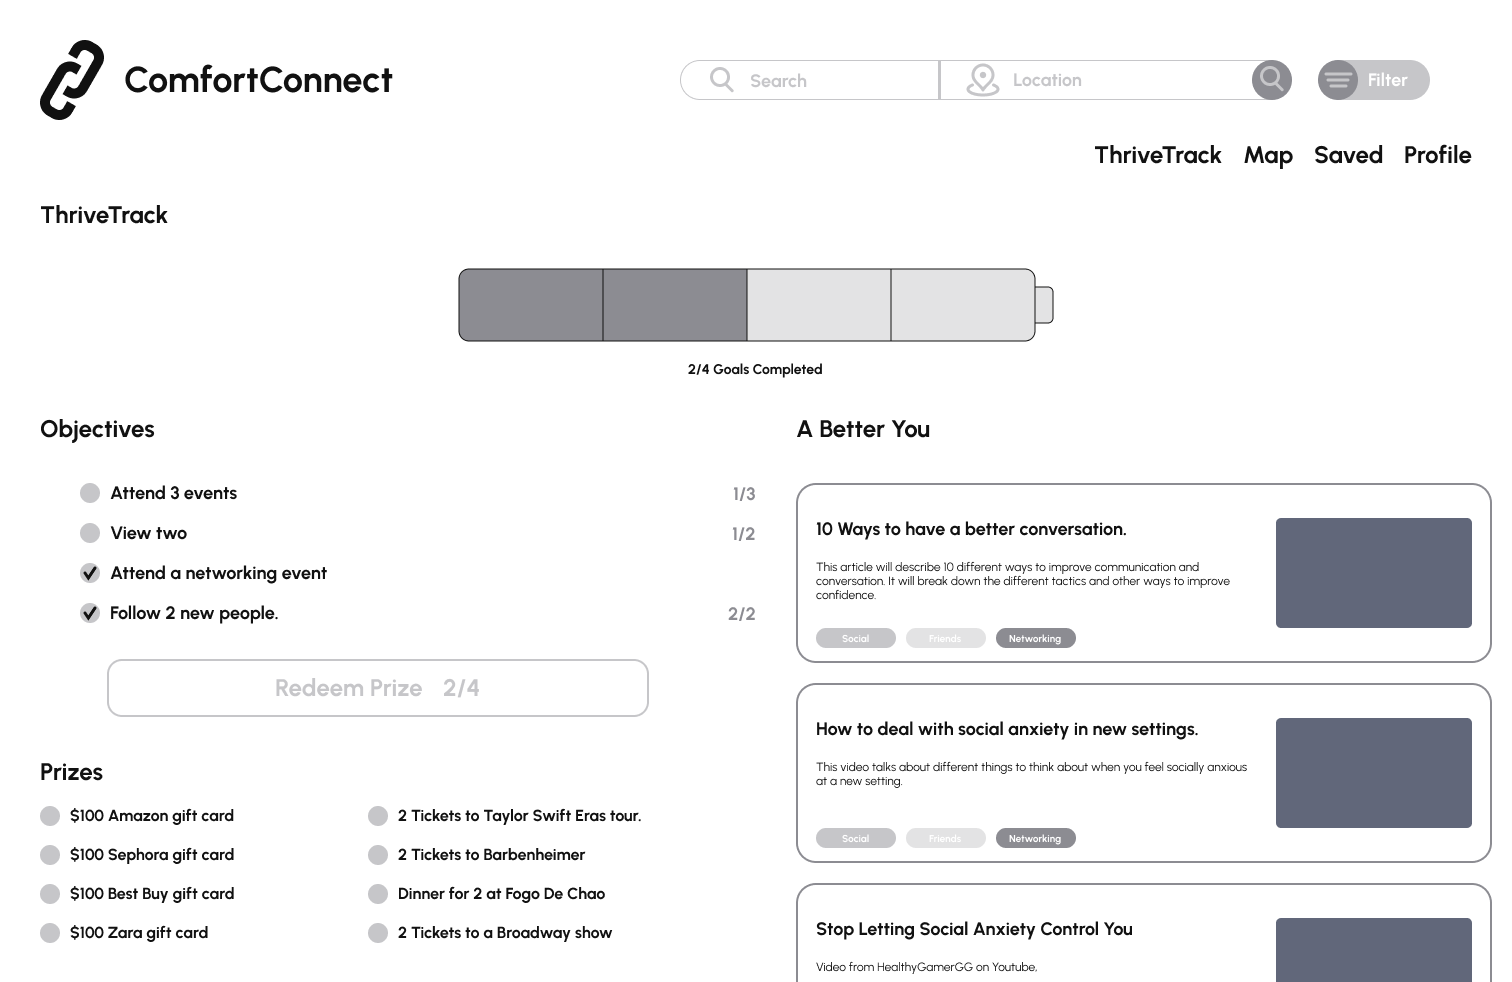
ComfortConnnect
Online commerce platform
where users can purchase event tickets and meet new friends.
Roles
User research & User interface design
Project Type
Individual student project at Springboard


.png)
.png)
 2.png)